-
Introduction to Support and Resistance
-
How to Use Support and Resistance
-
Trend Lines
-
Trend Channels
-
How to Trade Trend Channels
- General Guidelines for Trading Trend Channels
- Trading the Rising Trend Channel
- Bullish Continuation Pattern
- Bullish Breakout Pattern
- Bearish Reversal Pattern
- Trading the Falling Trend Channel
- Bearish Continuation Pattern
- Bearish Breakout Pattern
- Bullish Reversal Pattern
- True Breakouts vs. False Breakouts
-
Other Useful Indicators
-
Putting It All Together
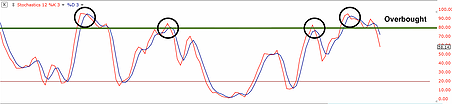
Overbought and Oversold
Another indicator worth adding to your chart is a trend indicator. The choice is usually between RSI and Stochastics. We choose stochastcis, but RSI works just as well.
Stochastics and RSI are trend/momentum oscillators used to identify overbought and oversold conditions.
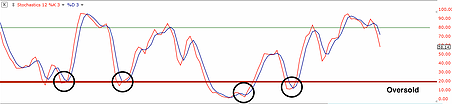
Oversold simply means that the stock price has reached a temporary bottom and buyer are most likely ready to come in and buy shares.
Overbought is the opposite. Stock price has reached a temporary top and sellers are most likely ready to come in and start closing positions or go short (short selling strategy).
When the lines of the oscillator cross above 80 (and higher), price is moving into overbought conditions. Get ready to sell or close positions.
When the lines of the oscillator cross below 20 (and lower), the price is moving into oversold conditions. Get ready to buy.
Stochastic Settings
Stochastics is one indicator. Fast, slow and full are merely definitions of that same indicator. The settings we choose is what defines whether that stochastics is fast, slow or full.
- FAST: %K is set to 1. We choose the period and the %D.
- SLOW: %K is set to 3. We choose the period and the %D.
- FULL: We choose the period, the %K and the %D.
Since the setting we use is 12,3,3 (Period= 12, %K= 3, %D= 3), we would call this a SLOW stochastics.
RSI Settings
The setting for the RSI are much simpler.
Choose the period you wish to analyze based on your trading style:
- 9 periods works well for day traders
- 14 periods works well for swing traders
- 21 periods works well for position traders and investors
Please make sure to watch the next lecture where I discuss how to use this indicator in conjunction with candlestick and technical analysis.


